
Analyze real usage cost of your BigQuery data warehouse
Jul 27, 2023 | 6 minute read
Jul 27, 2023 | 6 minute read
BigQuery is an amazing database. It will handle everything you throw at it, no matter the size… or cost.
And things are easy to overlook: BI tool doing full table scans hourly, new hire querying SELECT * on huge dataset or ETL script stuck in a loop…
You should be able to discover these before you get smacked with huge bill at the end of the month.
Let’s figure out how to build a report to give us proper insights into what exactly we’re paying for.
First of all, we need to understand pricing for on-demand queries:
No matter how small the data, you will always be billed at least 10MB for it. If you query three tables (ex. using joins), you will be billed at least 30MB ($0.0001875).
Seems difficult to calculate, but BigQuery does most of the heavy lifting for us in special INFORMATION_SCHEMA tables. These hold data on the jobs (queries) ran in BigQuery, including cost. Looking at the schema, we can find two columns which could indicate data usage:
total_bytes_processed: Total bytes processed by the jobtotal_bytes_billed: Total bytes billed for the jobtotal_bytes_processed is what you can see in BigQuery console before you run a SQL query:

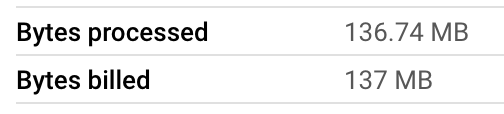
Many times processed and billed numbers will be pretty similar:
But if you incorrectly assume they are always the same, you’re up for a surprise:
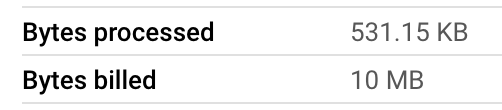
OK, seems pretty clear. total_bytes_billed will show us exactly how much we had to pay for given query. Let’s go straight to the code:
select
  creation_time,
  user_email,
  query,
  -- if job creation date is before 2023-07-05, it was priced at $5/TB. Otherwise, $6.25/TB.
  case
    when timestamp_diff(creation_time, timestamp("2023-07-05"), day) < 0
      then total_bytes_billed / pow(10,12) * 5.0
    else total_bytes_billed / pow(10,12) * 6.25
  end as cost_usd
from region-US.INFORMATION_SCHEMA.JOBS
group by 1, 2, 3
A lot has happened above, allow me to unpack:
We’ve ended up with raw cost data, but we can make it a little more usable - we’ll wrap previous query in CTE and do some basic aggregation:
with raw_data as (
  select
    creation_time,
    user_email,
    query,
    -- if job creation date is before 2023-07-05, it was priced as $5/TB. After that, $6.25/TB.
    case
      when timestamp_diff(creation_time, timestamp("2023-07-05"), day) < 0
        then total_bytes_billed / pow(10,12) * 5.0
      else total_bytes_billed / pow(10,12) * 6.25
    end as cost_usd
  from region-US.INFORMATION_SCHEMA.JOBS
)

select
  date_trunc(date(creation_time), month) as month,
  user_email,
  query,
  sum(cost_usd) as cost_usd
from raw_data
group by 1, 2, 3
order by 1 desc, 4 desc
Aaand, we just went from data to knowledge:
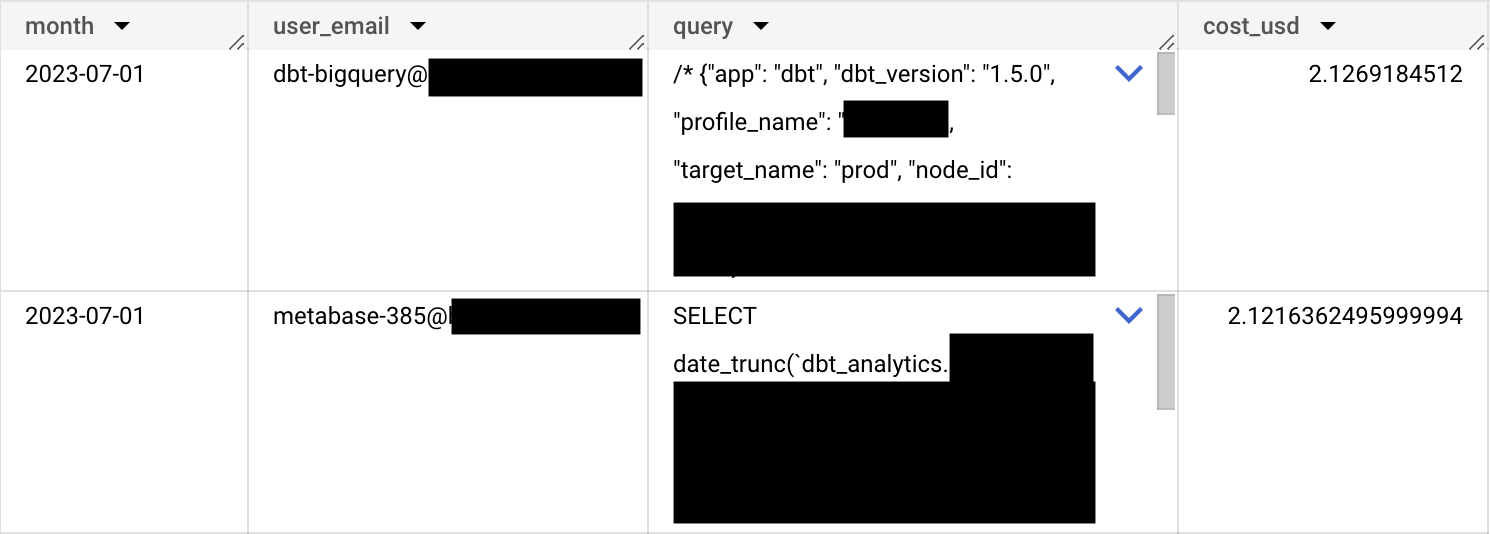
Above results are showing most expensive queries per month. If you’d like to know which user or service account uses most resources in total, remove query column from aggregation:
select
  date_trunc(date(creation_time), month) as month,
  user_email,
  sum(cost_usd) as cost_usd
from raw_data
group by 1, 2
order by 1 desc, 3 desc
This will also greatly reduce our analysis cost, as query column tends to be pretty big.
We don’t have to leave it at cost calculation - how about query performance metrics?
(...)
select
  avg(timestamp_diff(end_time, start_time, millisecond)) as avg_query_time_ms,
  max(timestamp_diff(end_time, start_time, millisecond)) as max_query_time_ms
(...)

